Click on Title to Expand……
Club Meetings at Mere are still cancelled due to the Coronavirus pandemic. A series of Zoom Meetings are arranged throughout the month.
Club Meeting – 26th November 2020 [via Zoom] Speaker, Mr Geoff Scargill, to give a talk entitled “The Secret Heart of Manchester”.
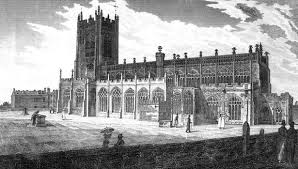
The presentation focused on that quarter of a square mile adjacent to Manchester Cathedral that comprises the medieval heart of the City. He chose to talk about this area in general and three buildings in particular, Chethams School, Manchester Grammar School and Victoria Station.
He first explained how Manchester had been founded 600 years ago, when the Lord of the Manor built his Manor House on an easily defended rocky hill at the confluence of the rivers Irk and Irwell.
He went on to explain how the town grew and how that Manor House still survives as part of the fabric of Chethams School, originally intended by its benefactor for the education of “poor boys who had lost their parents”. It eventually became the specialist music school we know now only as late as after the second world war. The school also still houses the famous Chethams Library, the first free public library, still functioning and still open to the public every weekday. This is a popular destination for Soviet and Chinese visitors for its association with Karl Marx and Friedrich Engels.
After describing how Manchester Parish Church grew to become the Cathedral that we know now, Geoff then told us something of the history of Manchester Grammar School which stood adjacent to the Cathedral until 1931, providing the highest level of academic schooling for the City.
We were then taken to Victoria Station, the largest railway station in the world when built in the 1840’s and at its height despatching up to 30 trains an hour to Blackpool on an August Bank holiday. Victoria Station has however its own medieval associations as it was built over the river Irk (now in an underground culvert) and over fields and ancient burial grounds associated with the Cathedral.
Club Meeting – 12th November 2020 [via Zoom] Speaker, Mr Neil Sheldon, to give a talk entitled ‘Lies, Damned Lies and Statistics’.
Neil introduced his talk by telling the members that he was a qualified Statistician, with many years of experience, including working in the teaching profession. He added that at present, statistics seems to be getting a bad name with Covid 19.
He then went on to provide an overview of statistics and highlight some of the pitfalls. Neil said that statistics are designed to provide information, an understanding and an insight into a subject. They are designed to give clarification in order to enable better decision making.
Starting with averages, Neil used the NHS figures for the average daily calorie intake per day for men and women as an illustration, and showed how variation or spread of data could be far more important than just the average. Then, using a car park as another example, he showed how two methods of data collection could give two different equally valid averages about car usage. The differences in this case were caused by the way in which the two sets of data were collected.
Using a chart, Neil described the ‘mode, median and mean’ values of a graphical display. These can be used to give three different ‘averages’, each of which could be used to emphasise a particular point of view. When considering incomes, the ‘mode’ is usually lower than the ‘median’ which in turn, is usually lower than the ‘mean’ value. He then went on to highlight the importance of looking beyond the ‘headline’ values. Using numerous examples, Neil showed how the ‘headline’ figure could give a completely false impression of the underlying data. In one example, based upon medical diagnosis, two sets of errors balanced each other out to give a headline figure, which implied that diagnostic errors were far fewer than those shown in the raw data.
Neil also looked at correlation, adding that correlation identifies a pattern, causation is an explanation of the pattern. It is very easy to see a pattern which implies correlation, when closer scrutiny of the underlying factors reveals a totally different explanation.
Another aspect of statistics which can give misleading results is ‘regression to the mean’. In one example, using aircraft passenger numbers to illustrate the point, Neil showed how most people will say that aircraft are always full, because there are far more passengers on a full aircraft than on an almost empty one. Consequently, whilst passenger surveys imply aircraft are always full, the air travel industry surveys highlight the cost of running the almost empty aircraft.
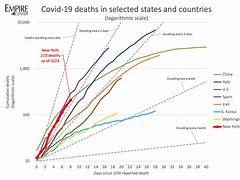
Neil concluded his talk with a look at the statistics for Covid 19. He stated that we are bombarded with headline figures daily, but rarely with the other information needed to put this into perspective. Whilst 50,000 deaths from Covid 19 is a grim milestone, the fatality figures are rarely backed by the average number of people who would have died during the same period. Between 2000 and 2018, the average annual death rate for the UK was between 550,000 and 616,000, with the largest year on year change of 33,000. The estimated figure for Covid 19 deaths worldwide is 1.27 million. The average number of deaths on the roads worldwide is 35 million per year. The average age of people dying from Covid 19 is about 80. The average age of fatalities on the roads is in the 35 to 40 years age range. Over forty years difference!
Finally, the comparisons between countries, and how successful or otherwise governments were in handling the pandemic, will take years. There are so many differences in the way in which the data is recorded and analysed, and also the reliability of the raw data, that at present, comparisons are at best approximate, and at worst, meaningless.
Neil then took questions from an appreciative audience.